Team performance
Team performance
# Team Reports
These reports provide statistics about your team's portfolios, workload, interactions, and update habits.
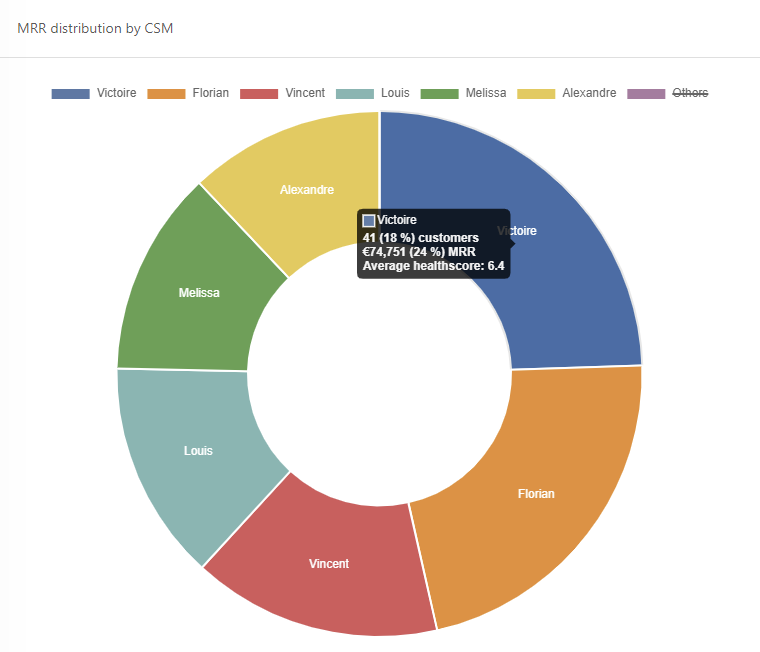
# Portfolio Distribution by Value
This graph shows each CSM's portfolio distribution by value. Hovering over a CSM's area displays:
- managed MRR
- Number of customers
- Volume breakdown
- Average health score
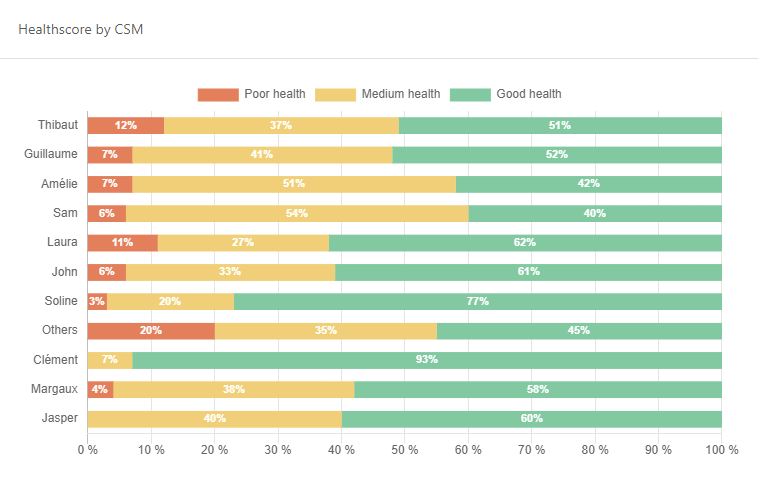
# Customer Distribution by Health Score
Shows the distribution of customers according to their health score per CSM. This is used to check if portfolio distributions are fair and consistent (not to evaluate each CSM!).
# Team Workload
Displays each team member’s workload based on tasks assigned:
- Overdue tasks
- Tasks due this week
- Tasks scheduled for later
**Tip:** The more you use Skalin for managing tasks and projects (especially with Playbooks), the more accurate this graph will be.
**Info:** The "Others" row includes unassigned tasks or those assigned directly to teams.

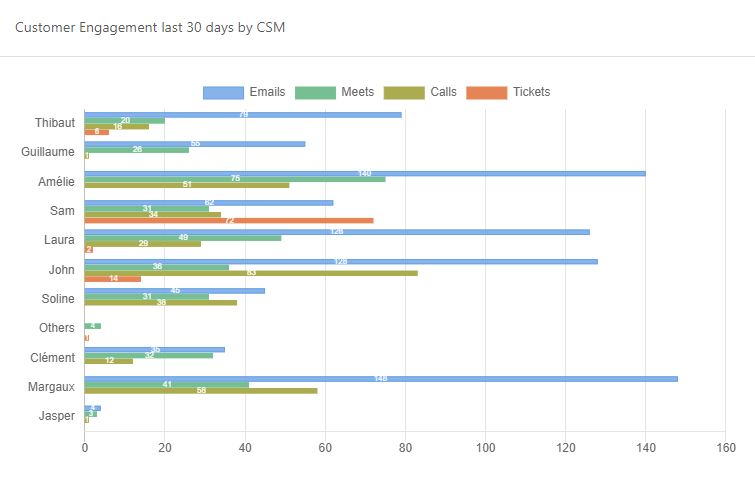
# Customer Engagement
Shows the number of interactions each CSM has had with their customers, broken down by type: email, call, meeting, or ticket. For emails, we count all outbound emails that the person has written to a customer or has been copied on (whether or not the customer is assigned to them). If a manager is copied on all customer emails, they will show a very high number of outbound emails! Click on labels to hide unwanted interaction types.
# CSM Pulse Updates
Highlights how regularly CSMs update their CSM Pulse. Regular updates help maintain accurate customer health insights. (Some reminders are automatically ringing in the My Actions section)
