Healthscore
Healthscore
All these reports have the same basic filters, which you can activate as required. Please refer to Filters and Tags.
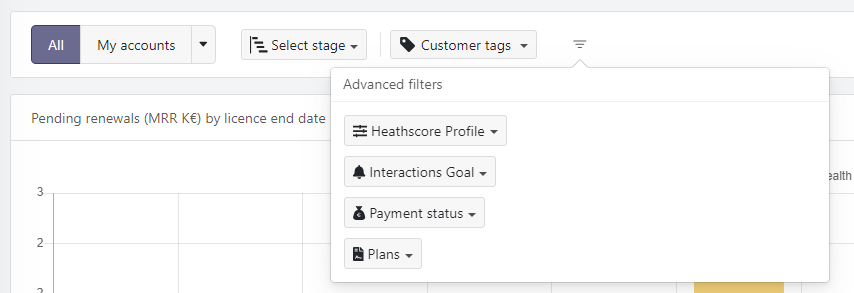
Note that specific filters are available for certain reports.
# Reports: Healthscore
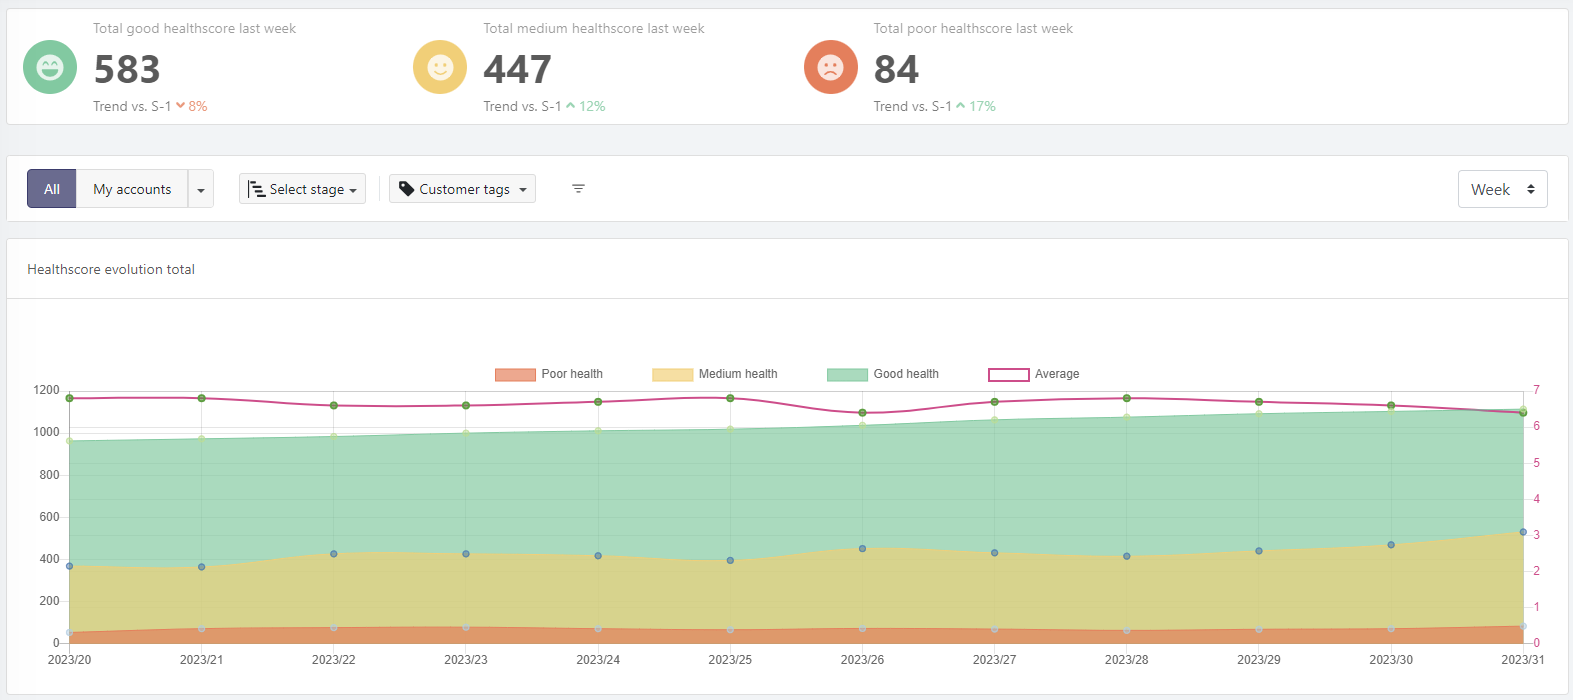
This report shows the evolution of your health scores:
- Volume graph: The first graph displays the number of customers with green, yellow, or red health scores. The purple curve shows the evolution of the average health score over the selected period. You can click on the legend to show/hide categories and use the filters above to focus on specific accounts.
The colors correspond to the following score ranges:
- Red: poor health — score of 1 to 3
- Yellow: mixed health — score of 4 to 6
- Green: good health — score of 7 to 10
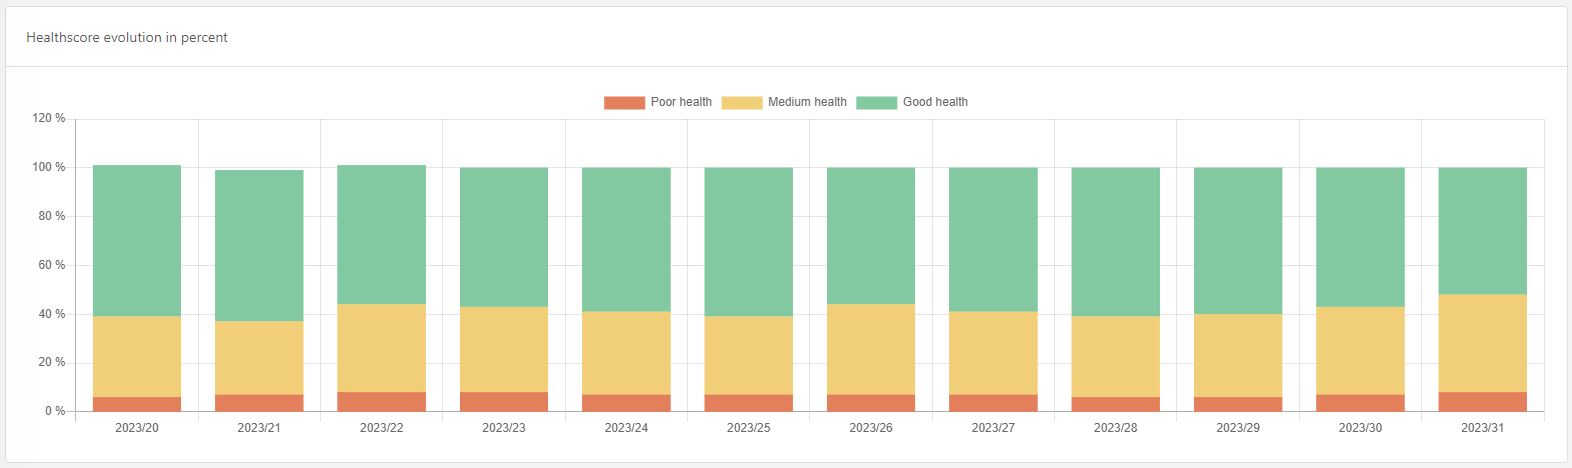
- Percentage graph: The second graph conveys the same information on a 100% basis, showing the percentage of customers in green, yellow, or red categories.