MRR
MRR
# CSM KPIs
The MRR report provides essential KPIs for managing CSM activity.
Here is how to read and interpret them.
Good to know:
These indicators are updated in real time based on the filters you apply below.
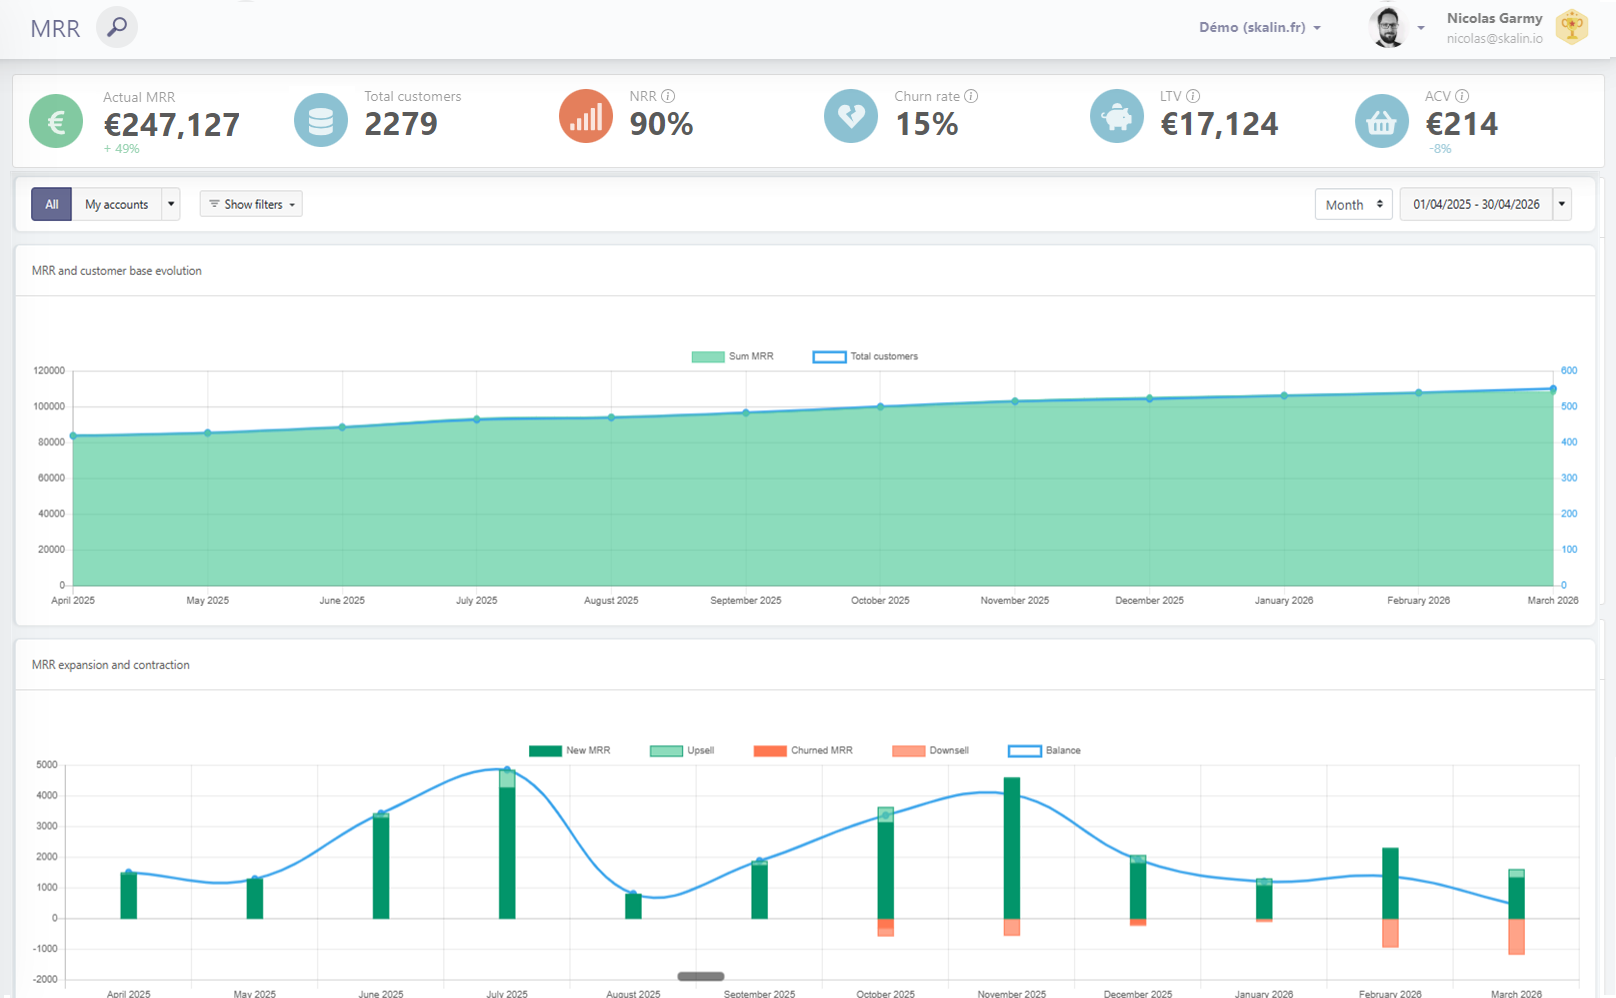
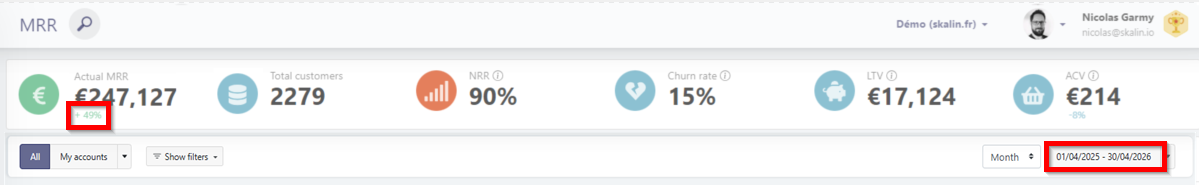
# Current MRR/ARR
Total MRR/ARR amount for the entire displayed portfolio. One-time fees are not included in this KPI since they are not recurring.
The trend indicator (green or red) below compares the current value to the value at the start of the selected period. In the example below, MRR increased by 49% between January and December 2025.
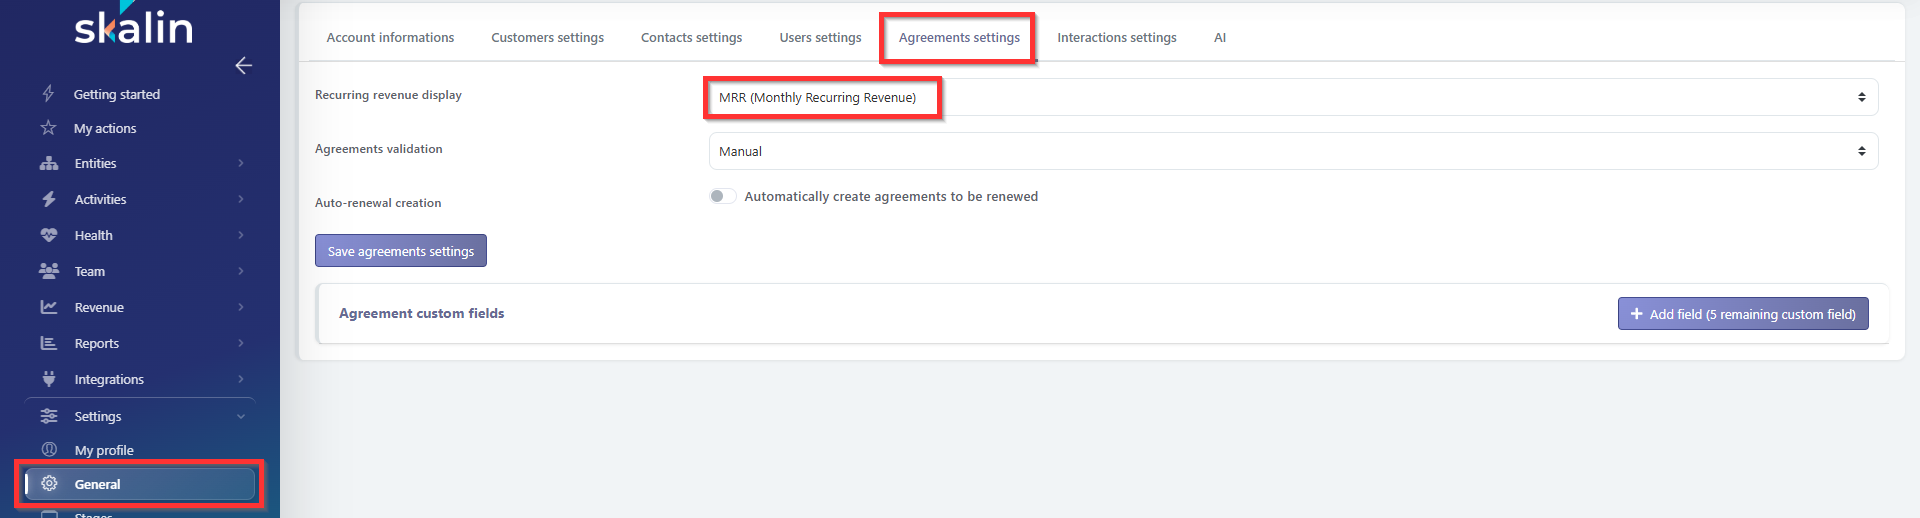
Reminder: to switch between MRR and ARR, go to General > Agreements Settings > Recurring Revenue Display.
# Total customers
Total number of customers at the end of the selected period, along with the delta between the start and end of the period.
Ex :

# NRR
Net Retention Revenue = (Initial MRR for the period + expansion − churn − downsell) / Initial MRR for the period NRR is calculated for each quarter, then averaged over the quarters in the requested period.
NRR represents the amount of recurring revenue a company is able to generate over a given period with a constant customer base — it measures the percentage of revenue retained including expansions. It accounts for both revenue lost through downsell or churn and revenue gained through upsell and cross-sell. It is therefore a global indicator of a company's ability to retain and grow its installed customer base.
If your retention rate exceeds 100, it means you are successfully offsetting revenue losses from existing customers through upsell and cross-sell (churn is compensated by expansion). This is a strong indicator of portfolio health, as you can grow even without acquiring new customers. SaaS leaders generate more than 120% NRR: now you know what to aim for!
NRR is generally considered to measure:
- Overall customer base health
- Expansion capacity
- The strength of the SaaS model
- Customer Success effectiveness
# Churn rate
Churn rate = (Downsell + churn for the period) / Initial MRR for the period
The churn rate is calculated per quarter, then averaged across the quarters in the selected period, and this figure is multiplied by the number of quarters in the period.
The "gross" churn rate represents the share of recurring revenue lost due to downsells and churn. It focuses solely on lost revenue. Here, 10 customers at €100 MRR carry the same weight as a single customer lost at €1,000 MRR — it's the value that counts, not the volume.
# LTV (Lifetime Value)
LTV = (Average MRR × 12 months) / Churn rate = ARPA × 12 months / Churn rate
LTV represents the total amount a customer will spend over the entire duration of their subscription. In SaaS, LTV is generally a forward-looking estimate rather than a measure based on historical data.
# ACV or ARPA (Annual Contract Value / Average Revenue Per Account)
ARPA = Total MRR / Number of customers This is the average MRR across your customers. ARPA is a metric that can be used to track your overall monetization strategy.
# Charts
# MRR and customer base evolution
The green line shows the total MRR evolution for each month or quarter (depending on your display settings), and the blue line shows the total number of customers. If you observe a sudden drop in the MRR curve that doesn't reflect the reality on the ground, check that MRR synchronization is still working correctly. Don't hesitate to contact your CSM to investigate the cause.
# MRR expansion and contraction
This chart visually shows, for each month or quarter, the amount gained (dark and light green) and the amount lost (dark and light red). The blue curve represents the net sum of gains and losses for each period.
Good to know:
Click on any bar to display a table of the customers involved in an upsell, downsell, or new MRR below.
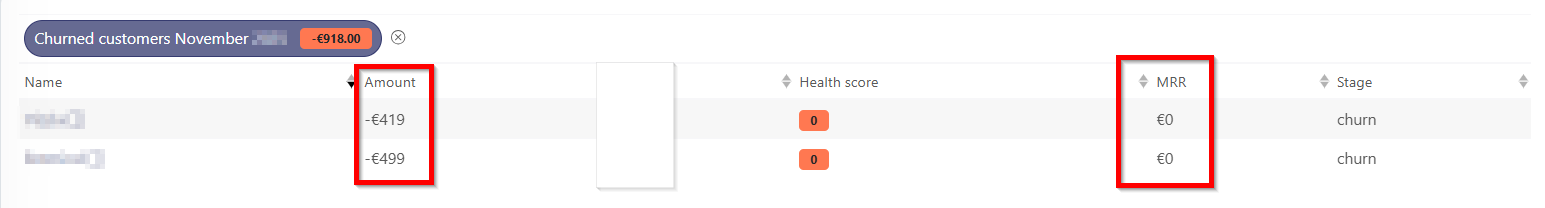
# Customer base expansion and contraction
This chart is similar to the previous one but describes the number of customers gained/lost rather than amounts. Likewise, clicking on a bar will display the relevant customer table.
In the example below, the "Amount" column shows the differential between the amount before the churn (or downsell) and the current amount. The "MRR" column shows the current amount.
# Additional resources
Feel free to refer to the Skalin blog articles (in French) to go further: